Find information on how trading metrics are calculated on kinfo
Kinfo works by integrating directly with a majority of the top brokers in the US. When linking your broker, kinfo will automatically download account data and calculate relevant trading metrics to help you measure your trading performance.
The trading metrics calculated are:
Before we dive into performance metrics, we need to understand what a trade is. A trade consists of at least one buy and one sell transaction.
Let´s assume you bought 1 share of AAPL on Oct 01 at $100 and you sold it on Oct 04 at $120. These two transactions become a trade with $20 profit.
A trade can consist of multiple transactions. Let´s assume you bought 1 share of AAPL on Oct 01 at $100, you then bought 1 additional share of AAPL on Oct 02 at $110 and sold both shares on Oct 04 at $120. These three transactions will make up 1 trade with $15 profit.
In the second example, your profit is $15 since your average acquisition price for your two shares is $105 ($100 + $110) /2.
It´s good to have a basic understanding of how this works, but you don´t have to worry about calculating this since kinfo does it for you.
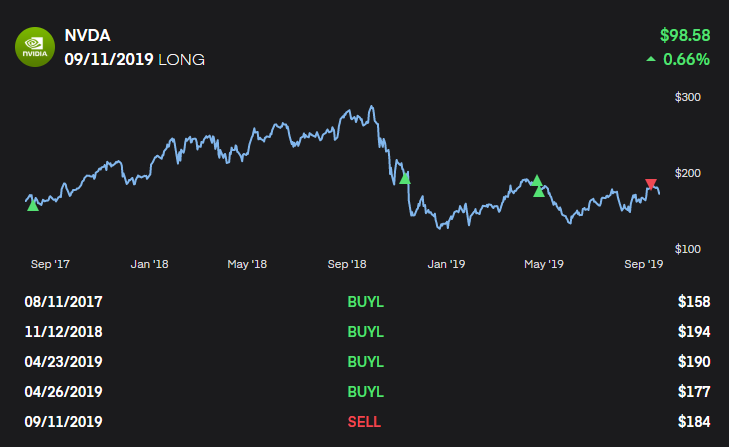
Below is an example of a profitable trade based on multiple transactions as shown on kinfo.
There are different ways of calculating a trade, one is called FIFO which stands for First-In-First-Out, LIFO stands for Last-In-First-Out and another is Average Cost. There are others but these are the most common ones.
Let´s assume you buy 100 shares of AAPL, then buy 100 additional shares of AAPL.
The you sell the first 100 shares, and later sell the last 100 shares.
Using FIFO the above transactions will result in 2 trades.
LIFO is the same but the last transaction is matched against the first.
Using average cost, a trade will be calculated once you reach a flat position (0 quantity).
In the above example 1 trade will be recorded and the profit will be calculated based on the average of the two BUY and SELL transactions.
In general FIFO will display more frequent trades and will allow better tracking of buy-and-hold strategies. However, for active day-traders who may have 50 transactions in and out of a trade, FIFO may result in a lot of noise.
Average cost on the other hand will result in a single trade even if there are 50 transactions in and out of the trade. The downside is that it doesn´t record trades for buy-and-hold strategies until trades are closed out.
Brokers will use FIFO or LIFO on account statements and for tax reporting.
Kinfo uses the Average Cost method to calculate trades.
This metric will take multiple trades over a period of time and calculate an average gain of those trades. Let´s assume you make 5 trades over a month as illustrated below
Let´s assume you have closed out a few trades according to the table below
| Exit date | Symbol | Gain |
| Oct 01 | AAPL | $20 |
| Oct 08 | NVDA | $30 |
| Oct 15 | MSFT | -$20 |
| Oct 22 | AMZ | $10 |
Your total gain for the period is $40 based on 4 trades ($20 + $30 – $20 + $10). Your average gain per trade is $10, as calculated by taking your total gain and dividing it by the number of trades ($40 / 4).
| Exit date | Symbol | Acquisition price | Gain | Gain in % |
| Oct 01 | AAPL | $100 | $20 | 20% |
| Oct 08 | NVDA | $110 | $30 | 20% |
| Oct 15 | MSFT | $100 | -$20 | -20% |
| Oct 22 | AMZ | $100 | $10 | 10% |
| Exit date | Symbol | Gain | Win? |
| Oct 01 | AAPL | $20 | Win |
| Oct 08 | NVDA | $30 | Win |
| Oct 15 | MSFT | -$20 | Loss |
| Oct 22 | AMZ | $10 | Win |
| Date | Symbol | Gain | Cum gain |
| Oct 01 | AAPL | $20 | $20 |
| Oct 08 | NVDA | $30 | $50 |
| Oct 15 | MSFT | -$20 | $30 |
| Oct 22 | AMZ | $10 | $40 |
